Updated on
April 2, 2026
Glucose Spikes: What Your Blood Sugar Reveals About Your Metabolism
You eat lunch, feel fine for twenty minutes, then hit a wall. The afternoon slump arrives, concentration drops, you reach for something sweet. Most people blame a busy week. But the real explanation is often playing out in your bloodstream, meal by meal.


Blood sugar management is no longer just a concern for people with diabetes. Researchers and clinicians now understand that how your body responds to food, how steeply glucose rises and how quickly it falls, can shape your energy, your mood, your sleep, and over years, your long-term metabolic health.
Understanding this starts with a few key biomarkers. And increasingly, people who have never come close to a diabetes diagnosis are asking those exact questions.
Ready to take charge of your health?


What actually happens when your blood sugar spikes
Every time you eat carbohydrates, your digestive system breaks them down into glucose, which enters the bloodstream. Your pancreas responds by releasing insulin, a hormone that signals cells to absorb that glucose for energy. This is completely normal. The question is how fast and how high.
When glucose floods the bloodstream quickly, a large insulin surge follows. Cells absorb glucose rapidly, and blood sugar can drop below the starting level, producing what many people experience as the afternoon crash. Fatigue, difficulty concentrating, and an urge to eat something sweet are the body's way of signalling that fuel is running low.
Over time, if this pattern repeats frequently, cells may begin to respond less efficiently to insulin. This is called insulin resistance, and research associates it with an increased risk of type 2 diabetes, fatty liver disease, and cardiovascular conditions, even in people who have no diagnosis and feel broadly healthy. [Study: NEJM Insulin Resistance Review]
"Metabolic health exists on a spectrum. A normal HbA1c today does not mean your glucose regulation is optimal. Tracking biomarkers over time can help you and your doctor understand the full picture."
Why this matters beyond diabetes
The framing of blood sugar as a diabetes topic has done a disservice to the wider conversation. Glucose regulation affects almost every system in the body, including people nowhere near a clinical threshold.
Research consistently links chronic glucose variability, even within the "normal" range, to increased inflammation, and some studies suggest associations with accelerated biological ageing, poorer sleep quality, and reduced cognitive performance. [Study: Glucose variability and inflammation, Frontiers in Endocrinology] Athletes notice it as inconsistent energy during training. Office workers notice it as concentration that drops sharply at 2pm. Parents notice it when they are irritable for no apparent reason after lunch.
Metabolic flexibility is the term for the body's ability to switch smoothly between burning glucose and burning fat. People with good metabolic flexibility tend to have steadier energy, tolerate skipping a meal without difficulty, and recover more quickly between periods of exertion. When flexibility is impaired, the body becomes dependent on a near-constant supply of carbohydrates to function.
Chronically elevated glucose, even subtly, also affects triglyceride levels and places strain on the liver. This is why metabolic health cannot be measured by blood sugar alone. A pattern of biomarkers tells the fuller story.
The biomarkers that reveal your metabolic picture
Four blood markers, measured together, give a clear view of where your metabolic health stands today.
Together, fasting glucose and fasting insulin are used to calculate the HOMA-Index, a measure of insulin resistance that can reveal dysfunction well before glucose levels cross any clinical threshold. [Study: HOMA-IR as early insulin resistance marker]
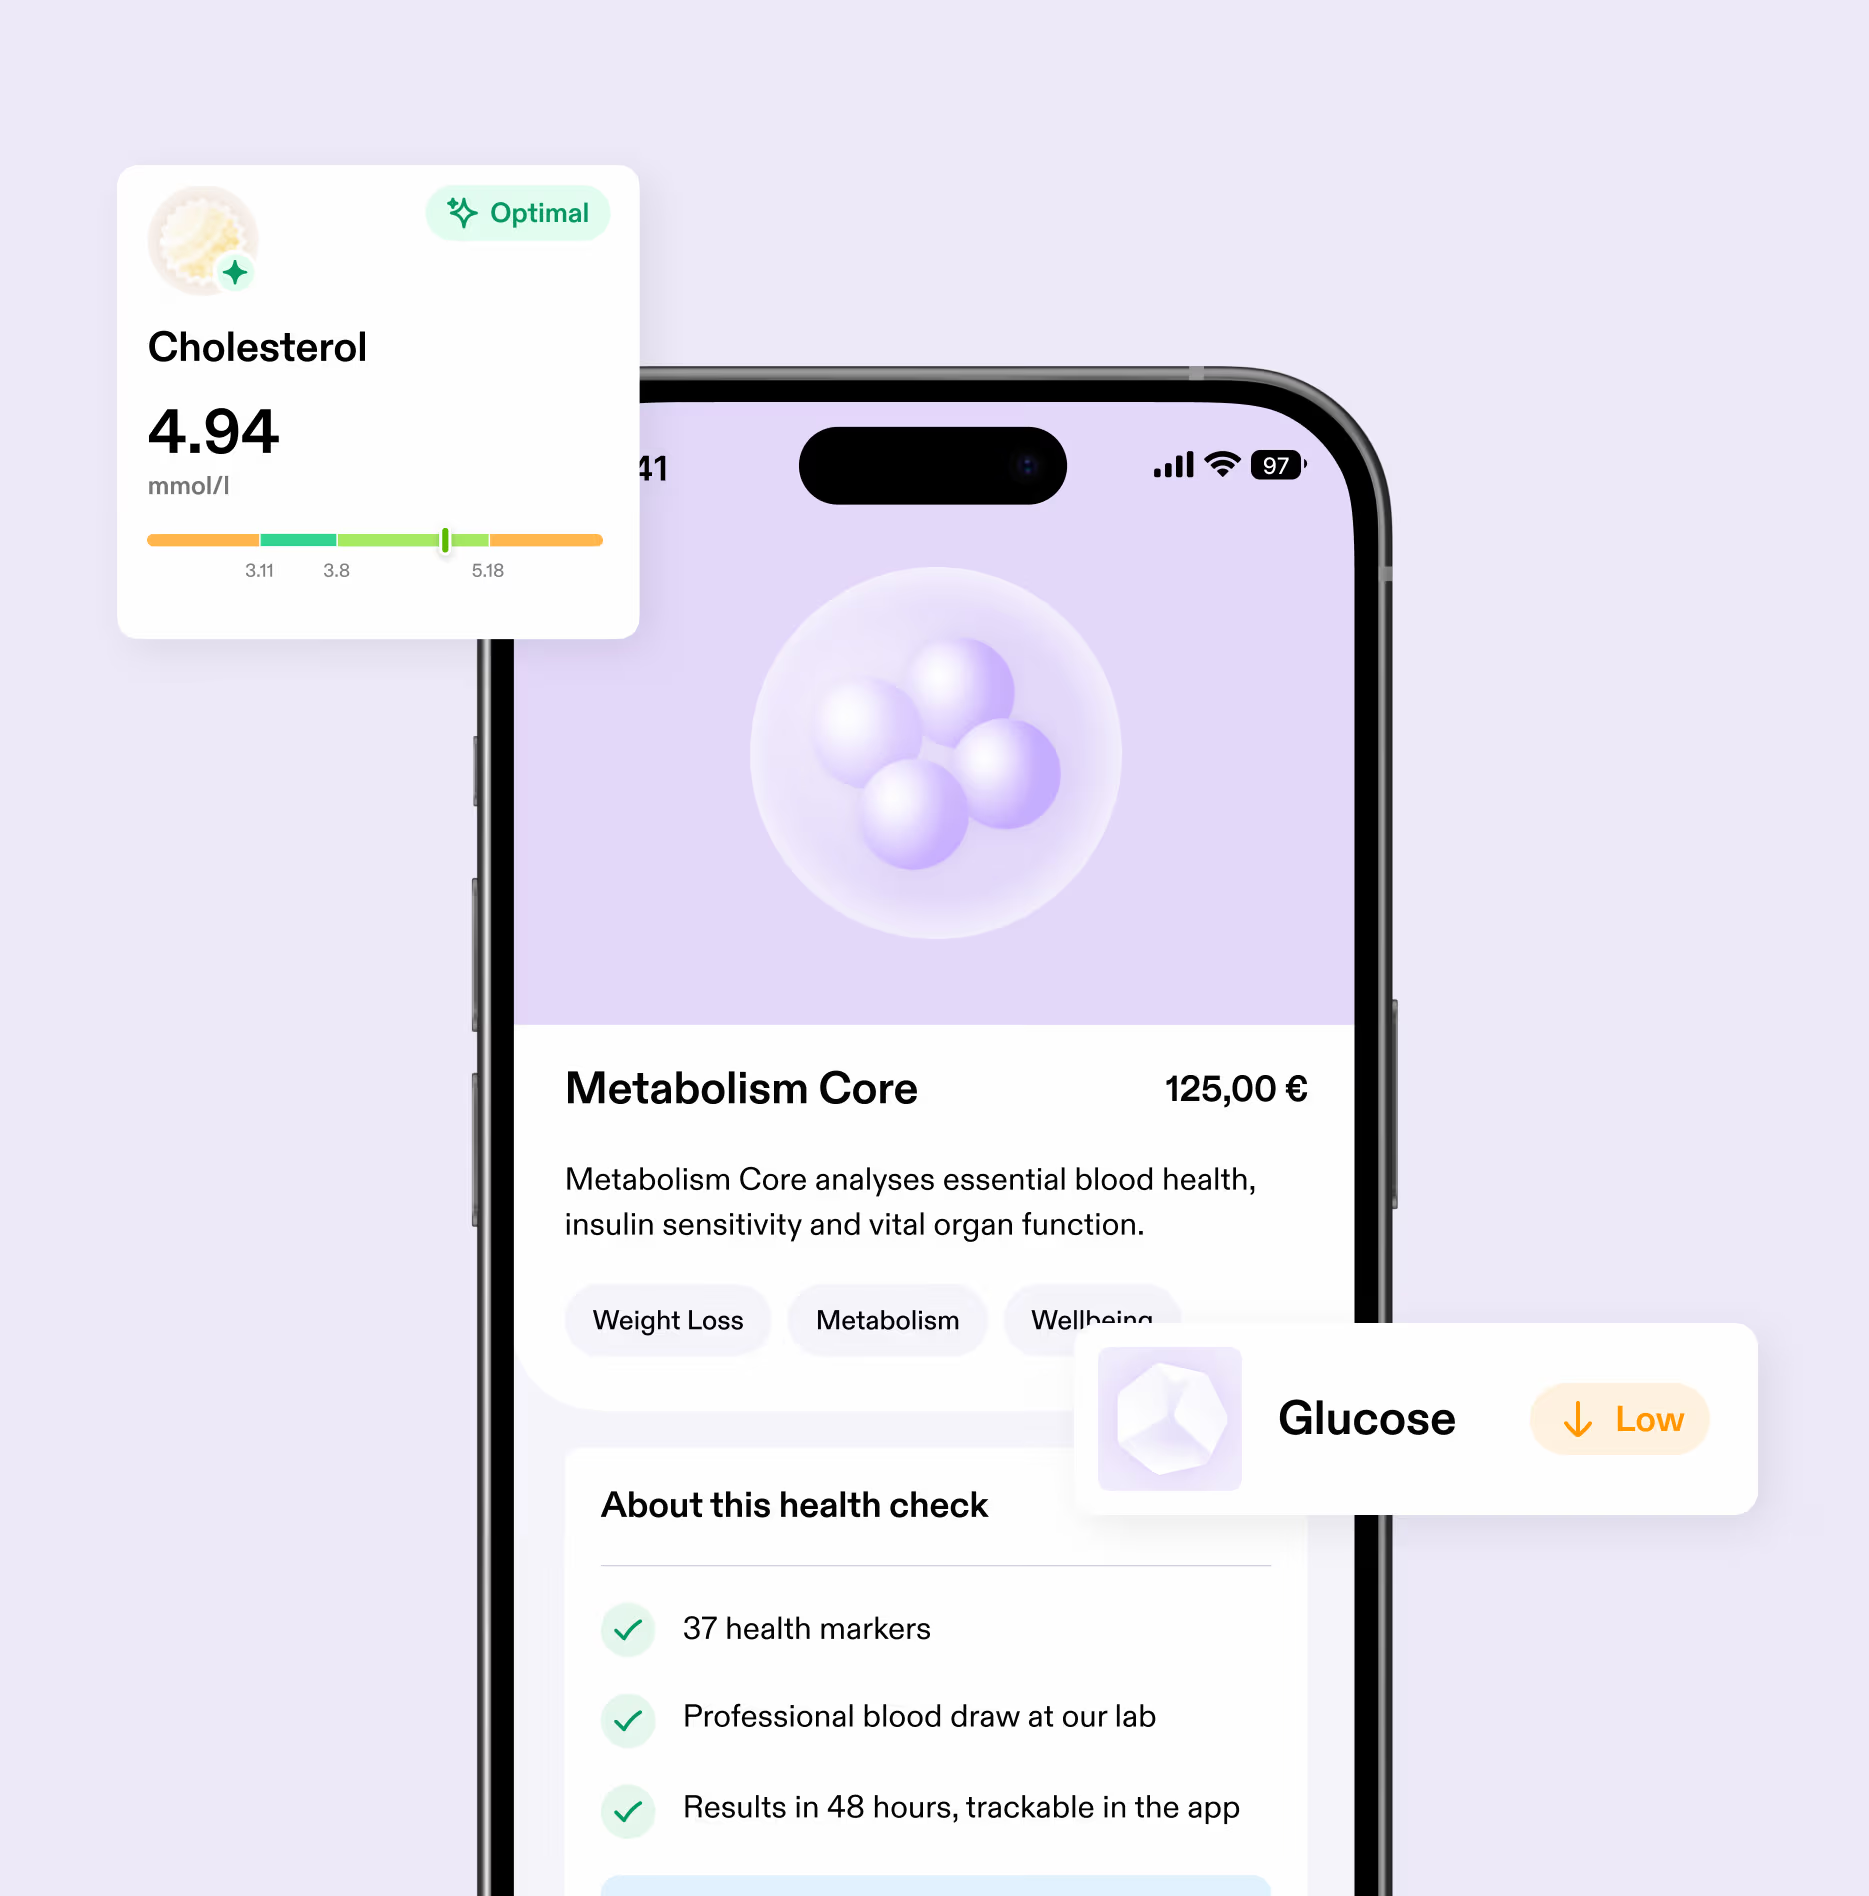
Metabolism Core Package
Metabolism Core analyses essential blood health, insulin sensitivity and vital organ function.
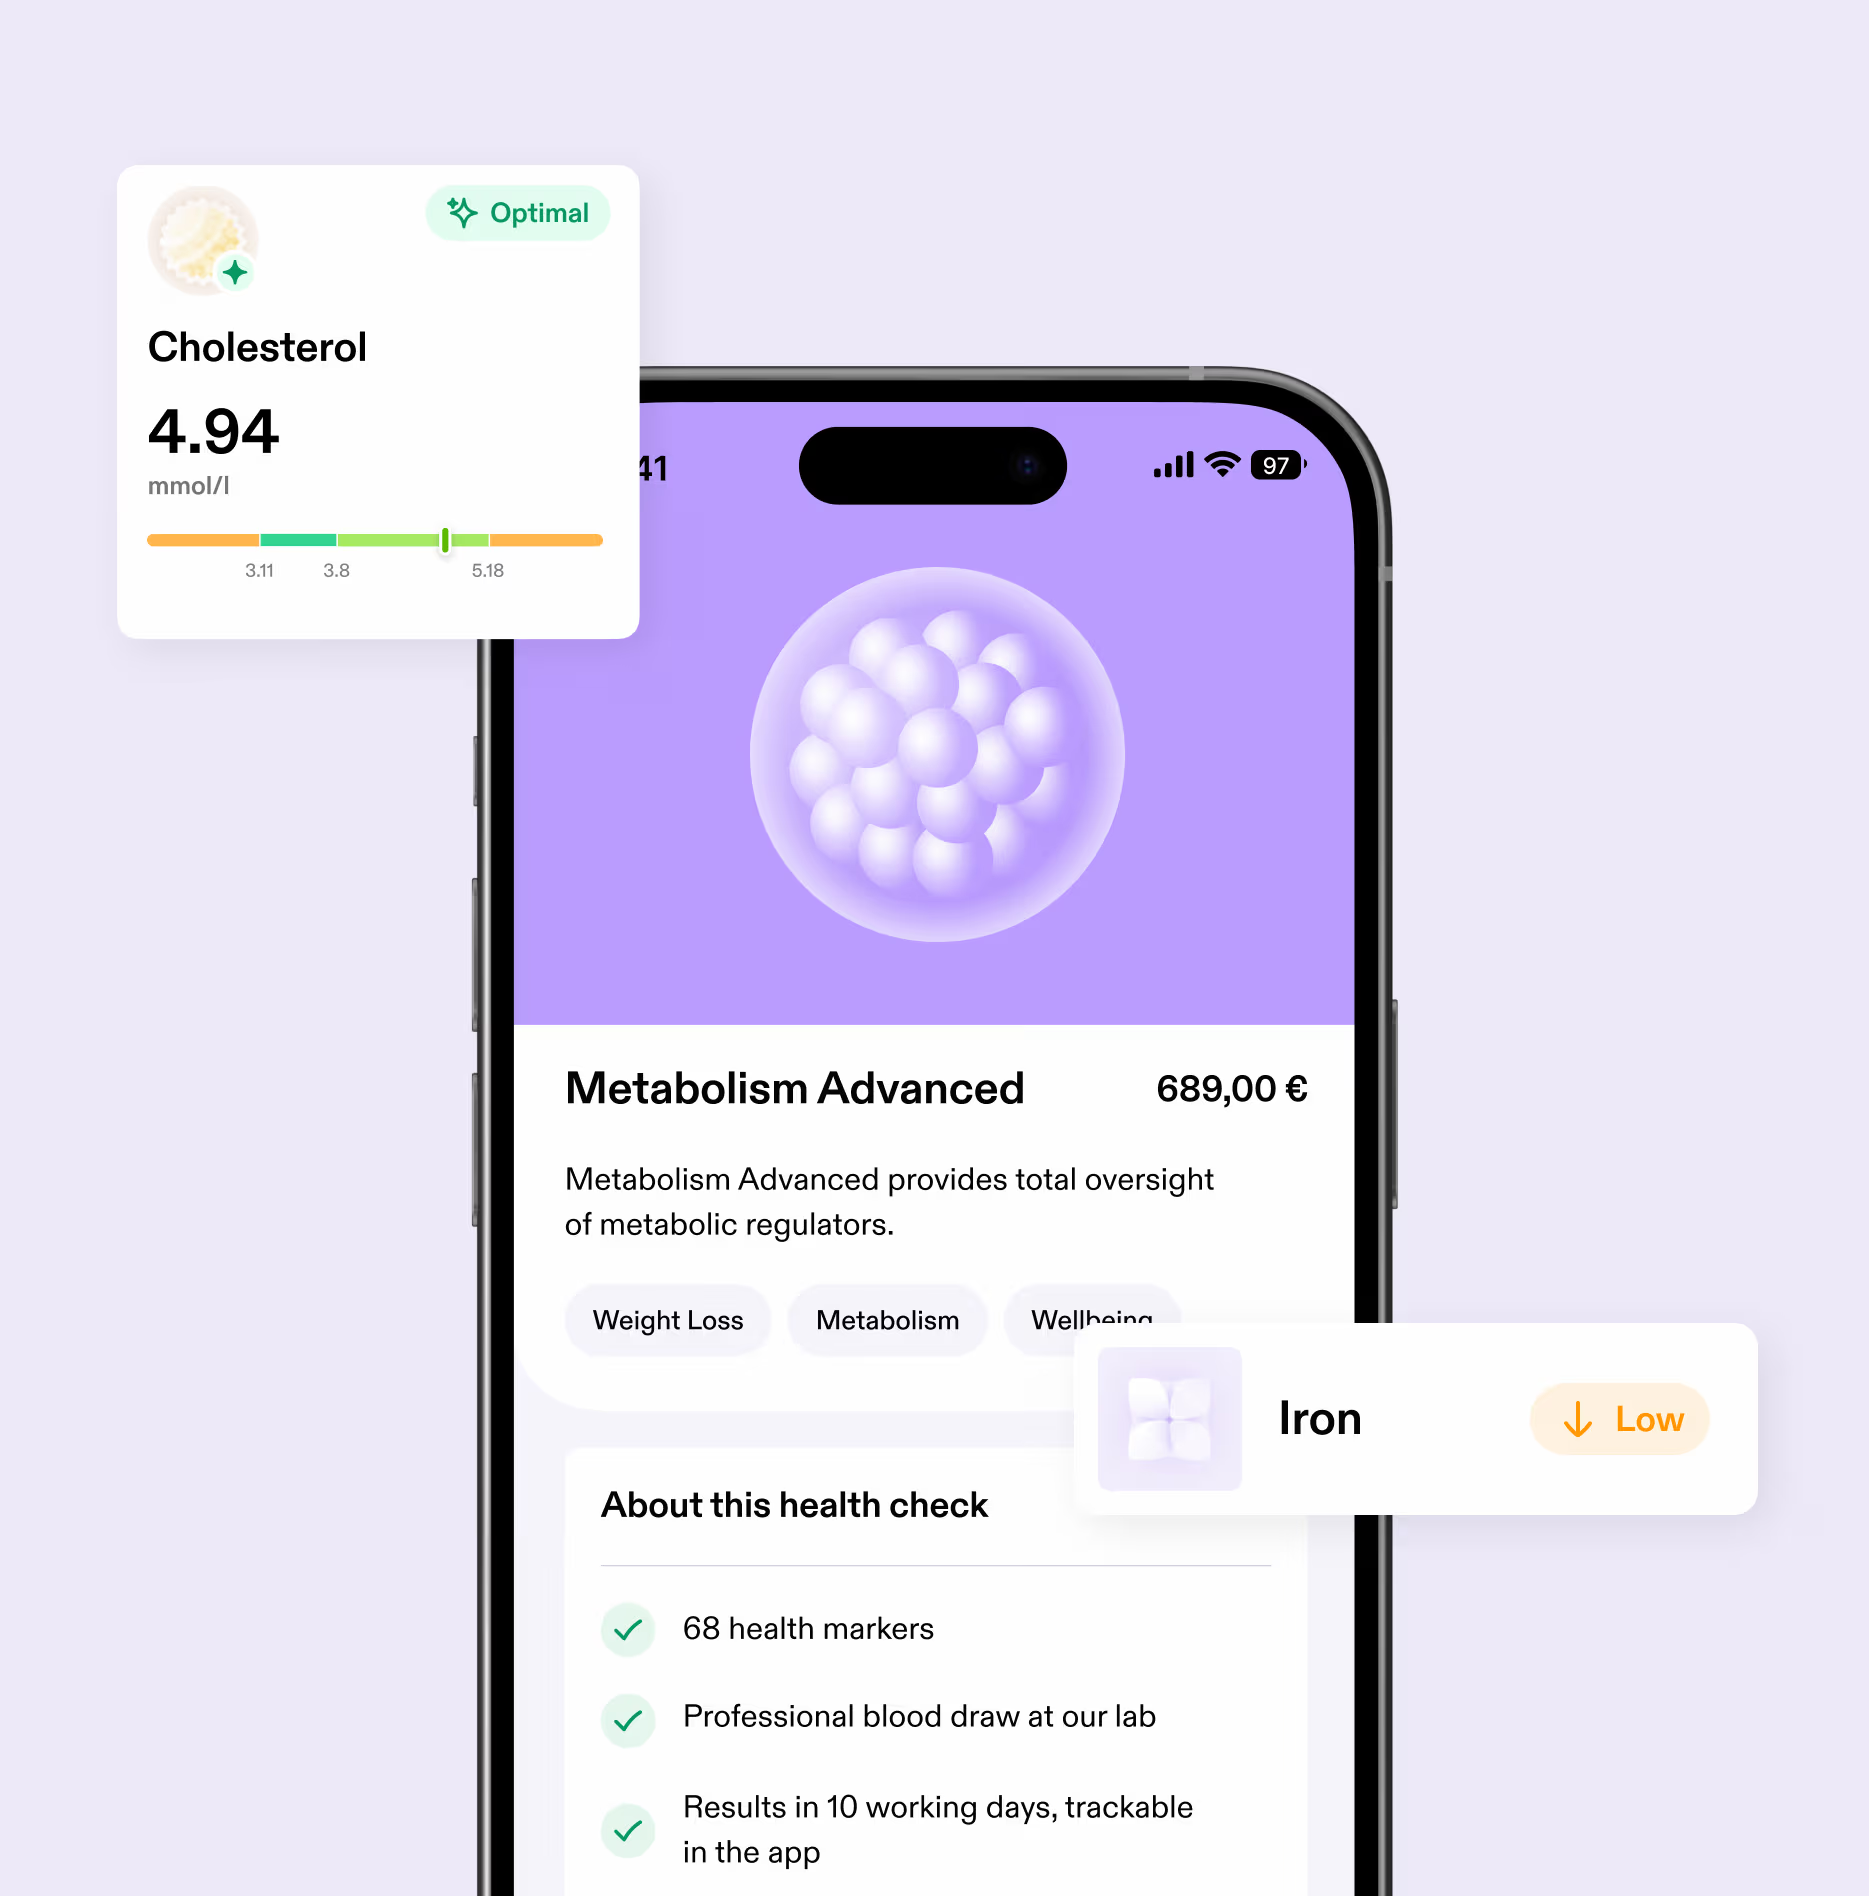
Metabolism Advanced Package
Metabolism Advanced provides total oversight of metabolic regulators.
What you can do with this information
Tracking these markers is the first step. What you do with the results is where the real value lies. Several strategies have good evidence for smoothing glucose responses and improving insulin sensitivity over time.
How to check your metabolic biomarkers with Aware
A single fasting blood draw covers all four core metabolic markers: fasting glucose, HbA1c, fasting insulin, and triglycerides, alongside a broader picture of liver enzymes and lipid health. Aware's Metabolism Core and Metabolism Plus packages are built around this exact cluster of biomarkers.
Results come back within two working days for the Metabolism Core Package (standard markers) and are displayed in the Aware app with reference ranges, trend tracking over time, and plain-language explanations of what each biomarker measures. This gives you context to have a more informed conversation with your doctor.
For a more detailed view, the Metabolism Plus package includes 48 biomarkers and adds advanced fatty acid profiling, making it relevant if you want to understand how dietary fat is influencing your metabolic picture over time. Results take up to 10 working days due to the fatty acid analysis.
What is a glucose spike?
A glucose spike is a rapid rise in blood sugar after eating, typically peaking 30–60 minutes after a meal before falling again. Large spikes followed by sharp drops are associated with fatigue, cravings and impaired concentration.
What are the early signs of insulin resistance?
Early signs can include persistent fatigue after meals, difficulty losing weight, increased hunger shortly after eating, and brain fog. Blood markers such as fasting glucose, fasting insulin, and HbA1c may point to insulin resistance before obvious symptoms develop. If you have concerns, speak with your Doctor. Blood testing through Aware can support that conversation by giving you a clearer picture of your current markers.
Do I need to have diabetes to track my blood sugar?
No. Metabolic health exists on a spectrum. Many people without diabetes still experience significant glucose fluctuations that affect energy, performance and long-term health. Tracking key biomarkers gives you clarity before problems develop.
What is metabolic flexibility?
Metabolic flexibility is the body's ability to switch efficiently between burning glucose and burning fat for fuel. People with good metabolic flexibility tend to have more stable energy levels and recover faster between meals.
How is HbA1c different from fasting glucose?
Fasting glucose is a snapshot of your blood sugar at a single point in time. HbA1c reflects your average blood sugar over the past 2–3 months, making it a more reliable long-term indicator of metabolic health. Used together, they give a much clearer picture than either alone.
Subscribe to our newsletter!
Articles, tips, and offers. Straight to your inbox.


Ready to take charge of your health?
Check, track, and improve your health and well-being.